Most people use a WPM typing test website as if every score means the same thing. It does not. Two sites can show the same WPM while measuring different text difficulty, punctuation load, correction behavior, and run length. If you want speed gains that carry into real writing, compare platforms with a fixed evaluation framework, then train on one primary site and verify on a second site each week.
If you have not set a stable baseline yet, start with Type Speed Test Baseline Routine: Measure Real Progress Before You Train. If your results jump between short and long runs, read Typing Test WPM: Normalize Scores Across Duration and Difficulty. If you need pacing control in timed sessions, use Timed Typing Test Pacing Strategy: How to Hold Speed Without Accuracy Collapse.
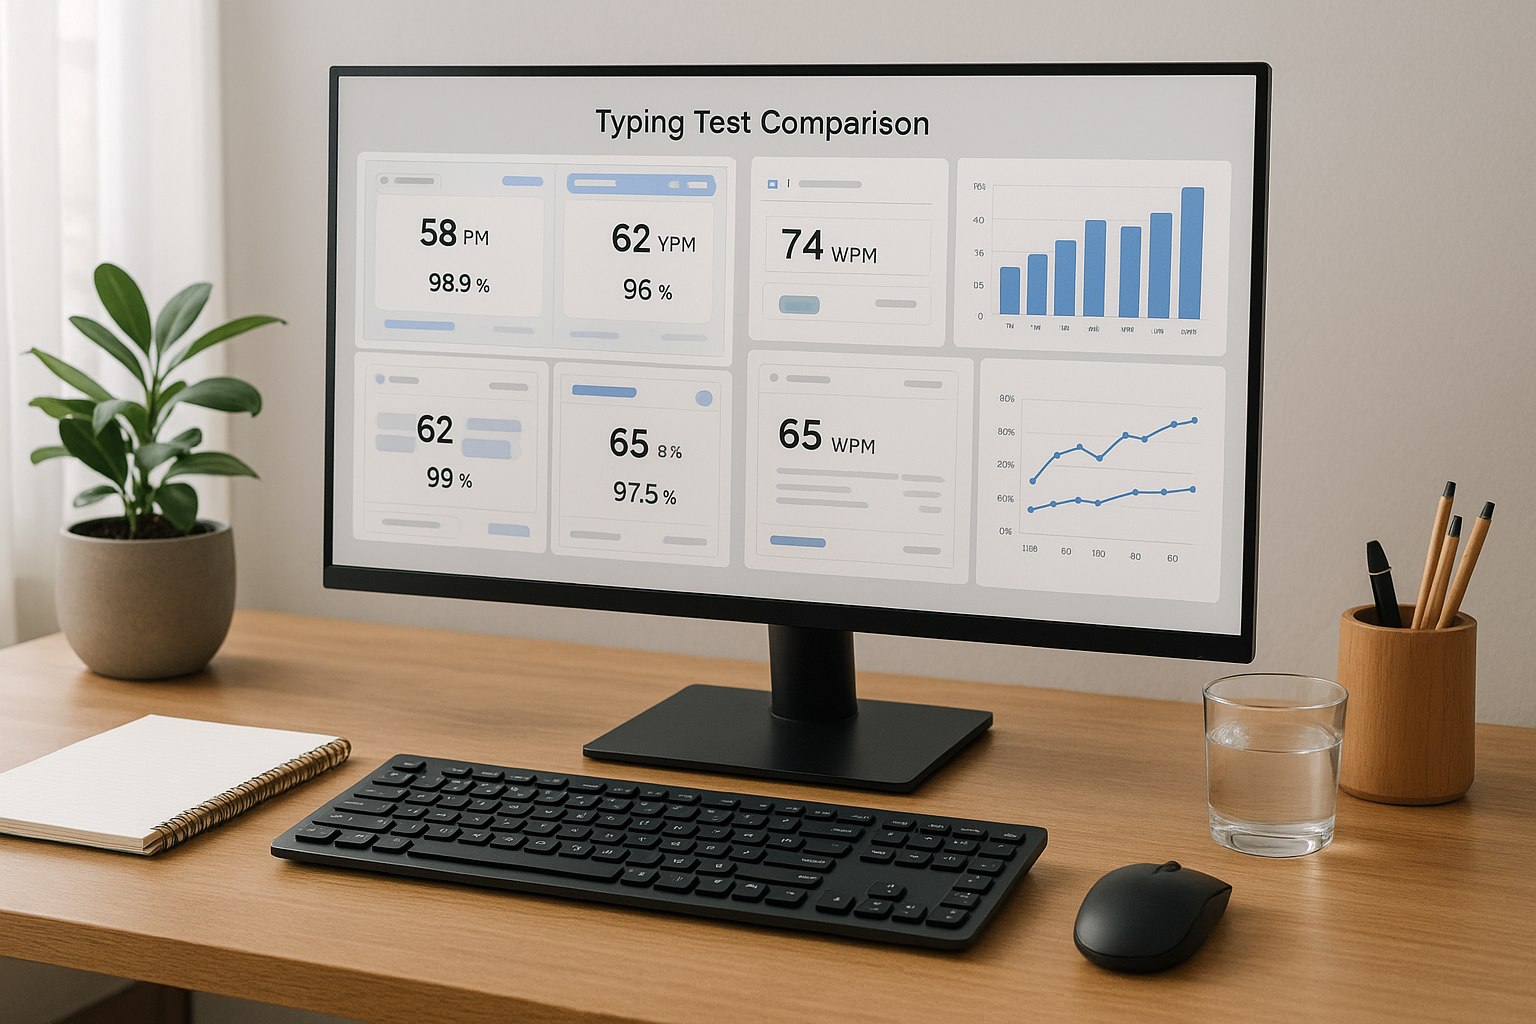
# Why WPM typing test websites disagree
WPM looks simple, but each platform defines the measurement context differently. Those design choices move your score.
Common causes of score drift:
- Different token model, where one site counts every 5 characters and another uses word based counting with punctuation penalties.
- Different passage mix, from plain words to code style text, numbers, or punctuation heavy snippets.
- Different correction policy, where backspace behavior may reduce reported pace directly or indirectly through elapsed time.
- Different timer defaults, which changes burst bias and fatigue effects.
- Different anti cheating or repeat passage controls, which alter familiarity effects.
This is why personal records often fail to transfer into work output. The score is real inside that test environment, but the environment may not resemble your daily typing load.
For statistical measurement principles, see the NIST Engineering Statistics Handbook (opens new window). For motor learning reliability in repeated tasks, review this NIH motor learning overview (opens new window). For workstation effects that can distort results, use OSHA computer workstation guidance (opens new window).
# The comparison framework for WPM typing test websites
Use one scorecard and keep it unchanged for each platform review cycle.
# Step 1: lock your test protocol
Before comparing sites, hold these variables constant:
- Same keyboard and layout.
- Same time of day window.
- Same run durations, usually 60 seconds and 120 seconds.
- Same warmup sequence.
- Same rest interval between runs.
Without protocol control, platform differences get mixed with daily variance.
# Step 2: collect minimum viable sample size
Run at least:
- 8 runs at 60 seconds.
- 4 runs at 120 seconds.
- 2 no timer control runs if available.
This sample size is large enough to calculate medians and spread while still practical for a single session block.
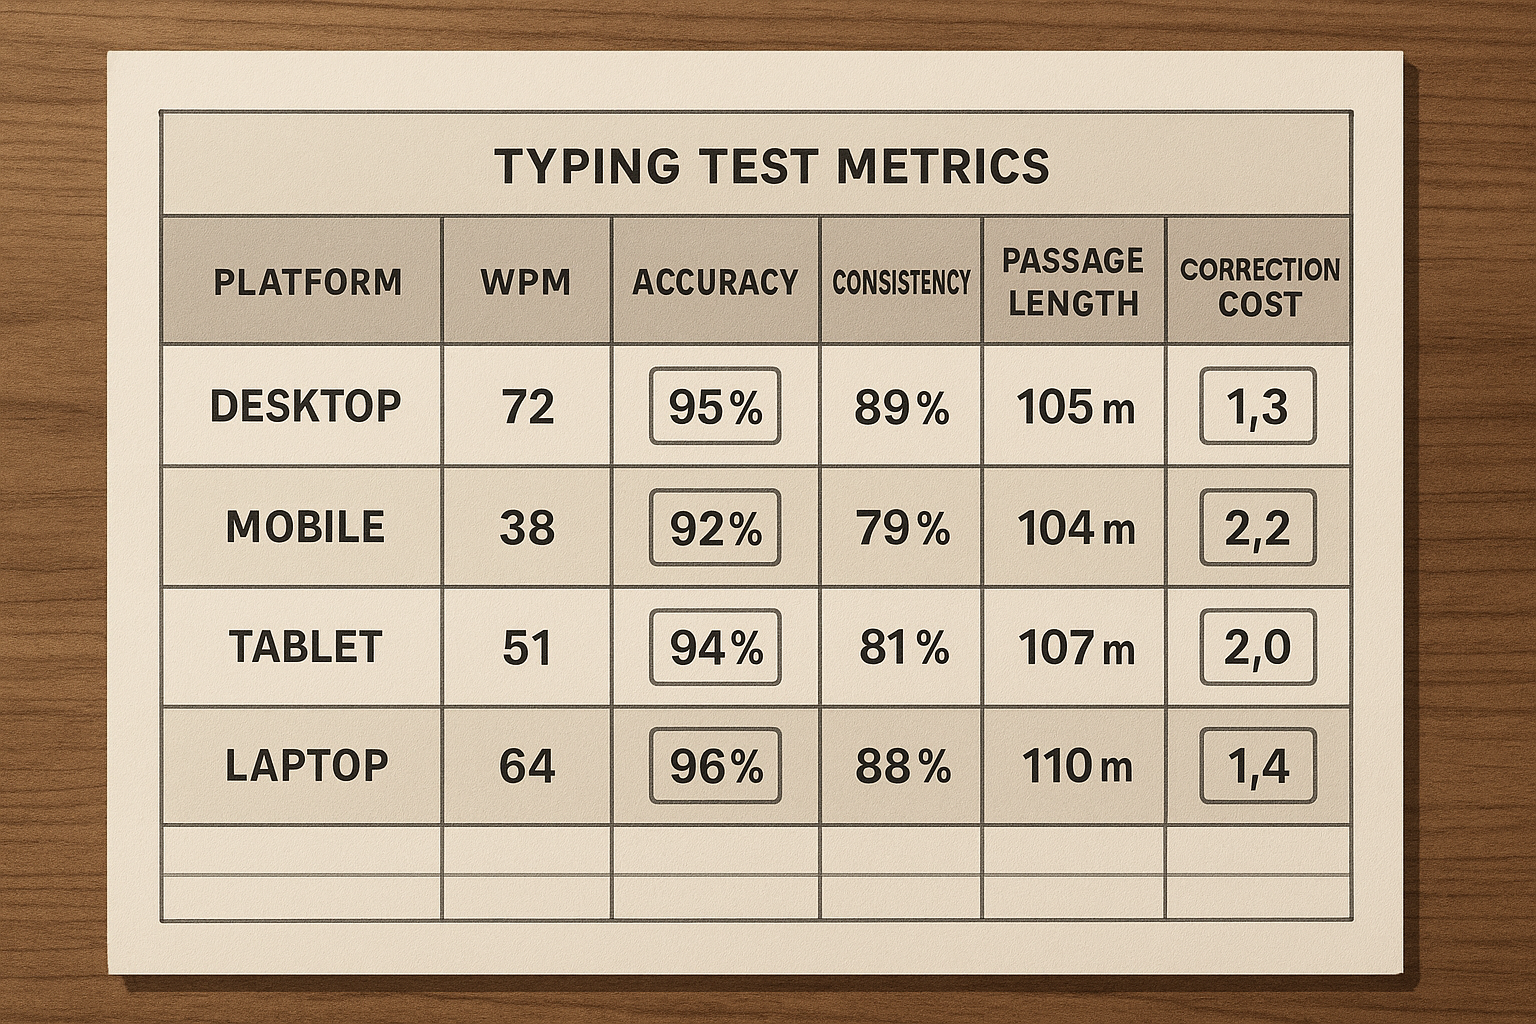
# Step 3: score platforms on transferable metrics
Track these metrics per platform:
- Median WPM.
- Accuracy percent.
- Interquartile spread, p75 minus p25 WPM.
- Correction density per 100 words.
- Finish segment drop, first half WPM minus second half WPM.
- Transfer ratio, real writing WPM divided by test median WPM.
Derived formulas:
correction_density = corrected_errors / words_typed * 100
transfer_ratio = real_task_wpm / median_test_wpm
# Step 4: decide with weighted criteria
Do not rank platforms by peak WPM. Rank them by training value.
Suggested weights:
- 30 percent transfer ratio.
- 20 percent stability spread.
- 20 percent correction density trend.
- 15 percent feature support for drills and analysis.
- 15 percent text realism for your task type.
# Practical scorecard you can copy
Use this checklist when reviewing each site.
- Passage difficulty feels consistent across sessions.
- Timer options include at least 60 and 120 seconds.
- Error breakdown is available by key or pattern.
- Session history export exists.
- Repeat passage rate is low.
- No timer mode exists for control work.
- Keyboard layout options match your setup.
- Results are readable enough to support weekly planning.
If a platform misses several of these points, it may still be useful for variety. It is a weak primary training surface.
# Decision table: choose your primary and secondary platform
| Your goal | Primary platform traits | Secondary platform traits | Watchout metric |
|---|---|---|---|
| Raise stable WPM from 50 to 70 | clear pacing runs, simple text, strong history logs | mixed passages for transfer check | high spread across sessions |
| Break through 70 to 90 plateau | detailed error taxonomy and segment analysis | harder punctuation or symbol mix | finish segment collapse |
| Improve coding related typing | support for numbers, symbols, mixed case | plain language benchmark site | low transfer to real coding |
| Prepare for data entry workloads | sustained runs and numeric heavy text | accuracy first control mode | correction chains |
| Recover from inconsistency | no timer mode plus conservative timed ladder | simple daily verification runs | unstable median despite practice |
Use one primary site for eighty percent of sessions and one secondary site for verification. Rotating five platforms daily creates noisy data and slows adaptation.
# How to interpret mismatched scores across websites
A common pattern is this: Site A shows higher WPM, Site B shows lower WPM, and your real writing looks closer to Site B. This result usually means Site A is easier for your current profile.
Interpretation rules:
- If WPM is higher but accuracy is lower, improvement is mostly pace inflation.
- If WPM is stable but spread narrows, you are building control.
- If correction density drops before WPM rises, improvement is on track.
- If transfer ratio improves while test WPM stays flat, training quality is improving.
Transfer ratio should guide platform choice. The best site is the one that helps real output move with fewer correction stalls.
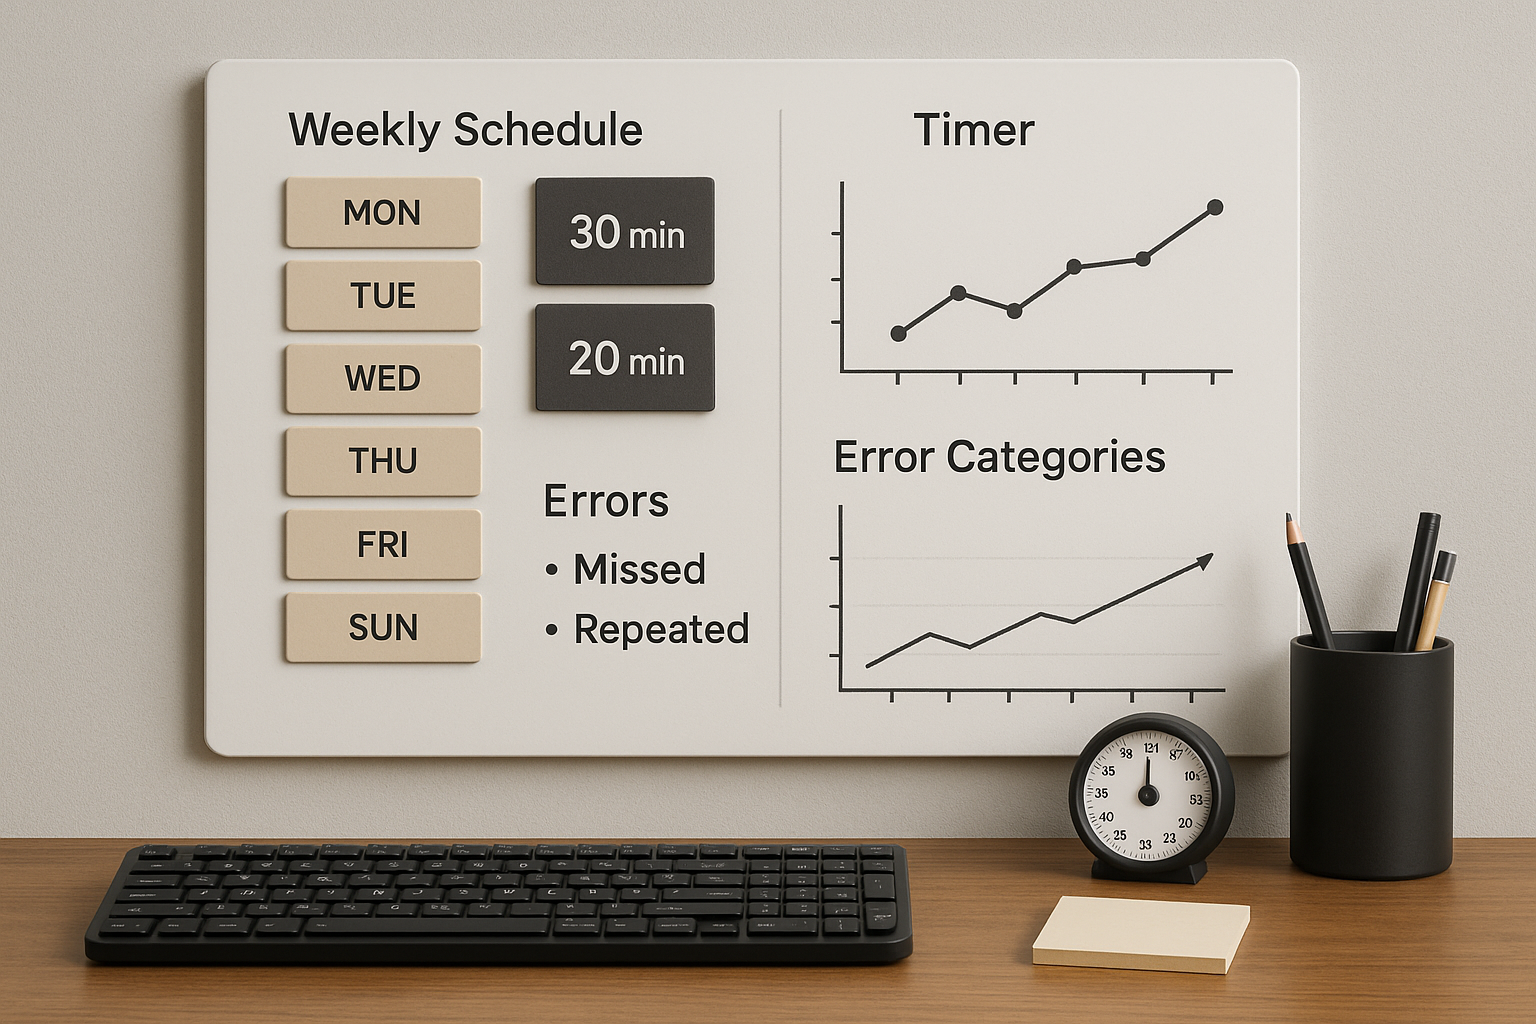
# Weekly workflow for platform comparison without overtesting
Run this seven day loop:
# Day 1: baseline on primary site
- 2 warmup runs.
- 6 timed runs at 60 seconds.
- 2 runs at 120 seconds.
- Log metrics and top error category.
# Day 2 and Day 3: focused training
- No timer control block.
- One error category drill.
- Two timed verification runs.
# Day 4: secondary site verification
- Repeat reduced protocol on secondary site.
- Compare medians and transfer ratio only.
# Day 5 and Day 6: correction and pacing block
- Segment pacing for timed runs.
- Finish segment protection work.
- Track correction density and spread.
# Day 7: review and next week setup
- Update scorecard.
- Keep primary site unless transfer ratio worsened for two weeks.
- Change only one variable for next week.
This cycle gives enough contrast to detect platform effects without turning each day into a data project.
# Common mistakes when selecting typing test websites
# Mistake 1: choosing the site with the highest peak score
Peak scores are poor planning inputs. Medians and spread describe repeatable performance.
# Mistake 2: changing duration and text type every session
Frequent format shifts reduce comparability. Keep at least one fixed benchmark format across the month.
# Mistake 3: ignoring correction cost
Two users with identical WPM can have different correction behavior. The one with lower correction density usually transfers better to real tasks.
# Mistake 4: training only on one passage style
Single style training can overfit to test content. Weekly secondary site checks reduce this risk.
# Mistake 5: skipping ergonomics
Poor keyboard angle, chair height, or wrist posture can suppress results and increase fatigue. Standardize setup before drawing conclusions from platform data.
# A worked example with three platform profiles
Assume you test three website profiles:
- Profile A, short plain text passages.
- Profile B, mixed punctuation and numbers.
- Profile C, analysis heavy with segment reports.
After one week:
- A median 78 WPM, accuracy 95.7, transfer ratio 0.82.
- B median 72 WPM, accuracy 97.1, transfer ratio 0.91.
- C median 74 WPM, accuracy 96.8, transfer ratio 0.89.
The highest WPM appears on A, but B and C show better transfer. If your goal is usable speed, choose C as primary if you need diagnostics, or B as primary if you need conservative accuracy focused progression.
Then verify every Saturday on the other platform. If transfer rises with stable spread, keep direction. If transfer stalls for two weeks, adjust text realism or pacing rules.
# Building your own TypeTest based comparison setup
Use TypeTest as a stable primary surface and apply a strict logging loop:
- Keep one benchmark preset for weekly comparisons.
- Store session medians and spread, not only best run.
- Track one drill category per day.
- Add one transfer check in real writing or coding tasks.
When your primary keyword target is WPM typing test, this setup also creates clearer content data for future decisions. You learn which subtopics carry signal, such as no timer control, finish segment pacing, or platform comparison methods.
# When to switch platforms
Switch primary platform only when one of these conditions holds:
- Transfer ratio declines for two consecutive weeks.
- Passage familiarity is clearly inflating scores.
- Needed drill features are missing.
- Your current goal changed, such as moving from general writing to symbol heavy coding.
If none of these conditions apply, stay put. Consistent measurement creates faster progress than constant platform hopping.
# Final takeaway
WPM typing test websites are tools, and tool choice changes your data. Compare sites with a fixed protocol, evaluate transfer first, and keep one primary platform long enough to build a clean trend line. The platform that gives you slightly lower but stable scores with stronger real world transfer is the better training choice.
For next steps, run one week with the scorecard above, then review your trend against WPM Test Typing Session Design: Build Scores That Transfer to Real Work and Typing Test No Timer Method: Build Speed That Transfers to Real Work. That combination gives you both control work and transferable pace gains.