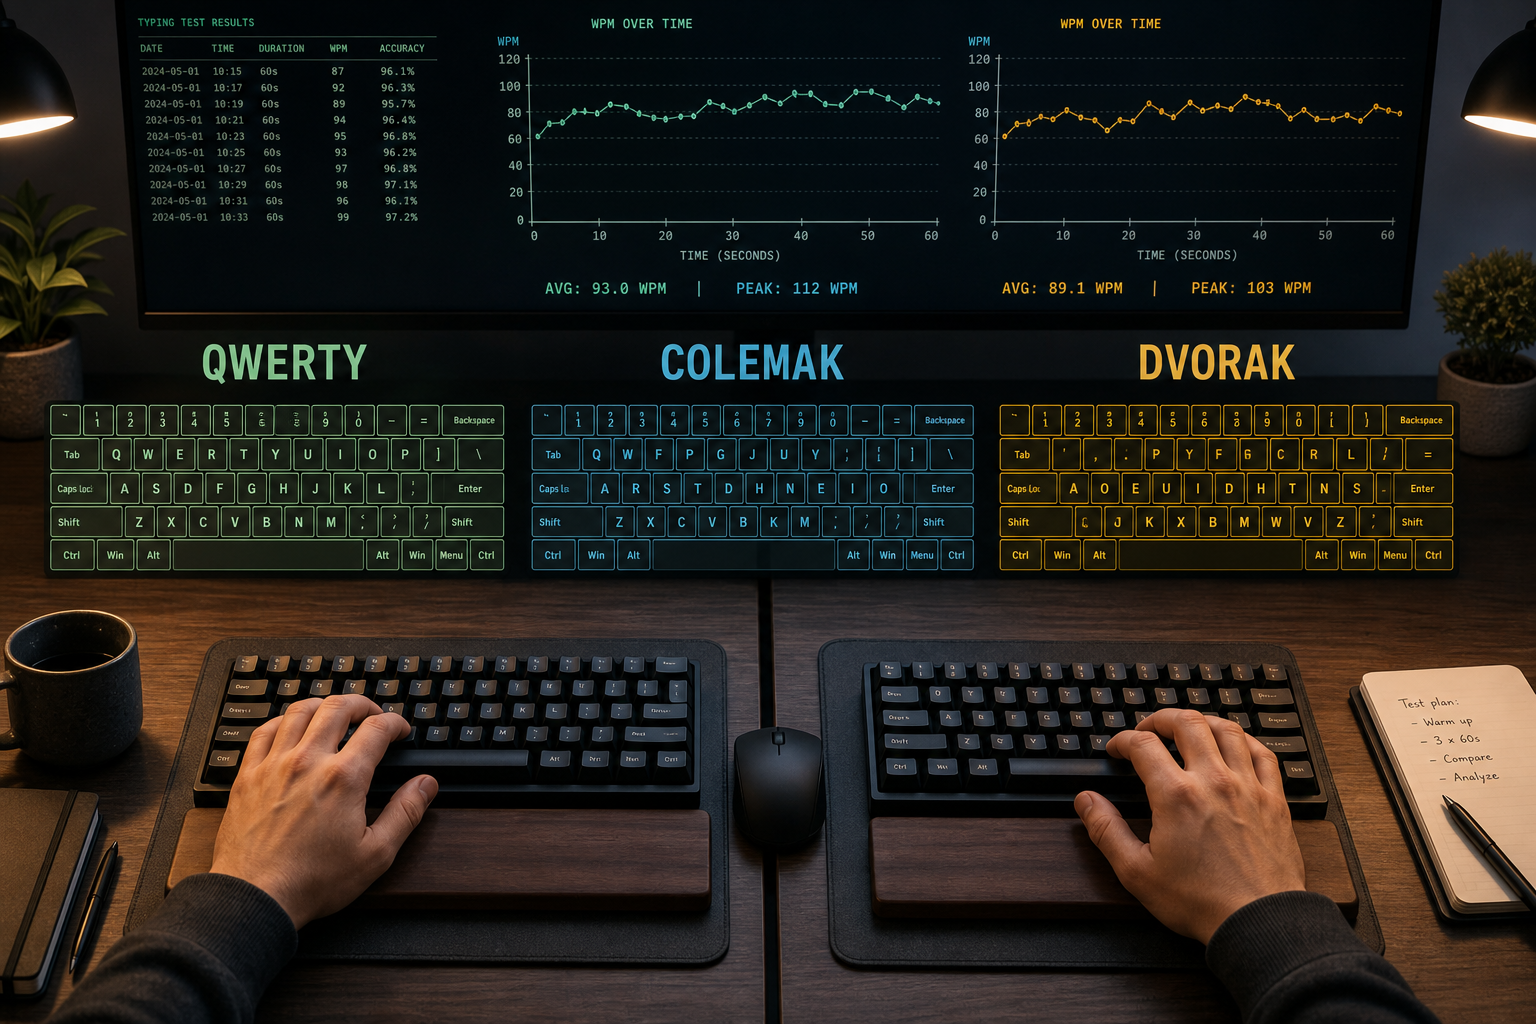
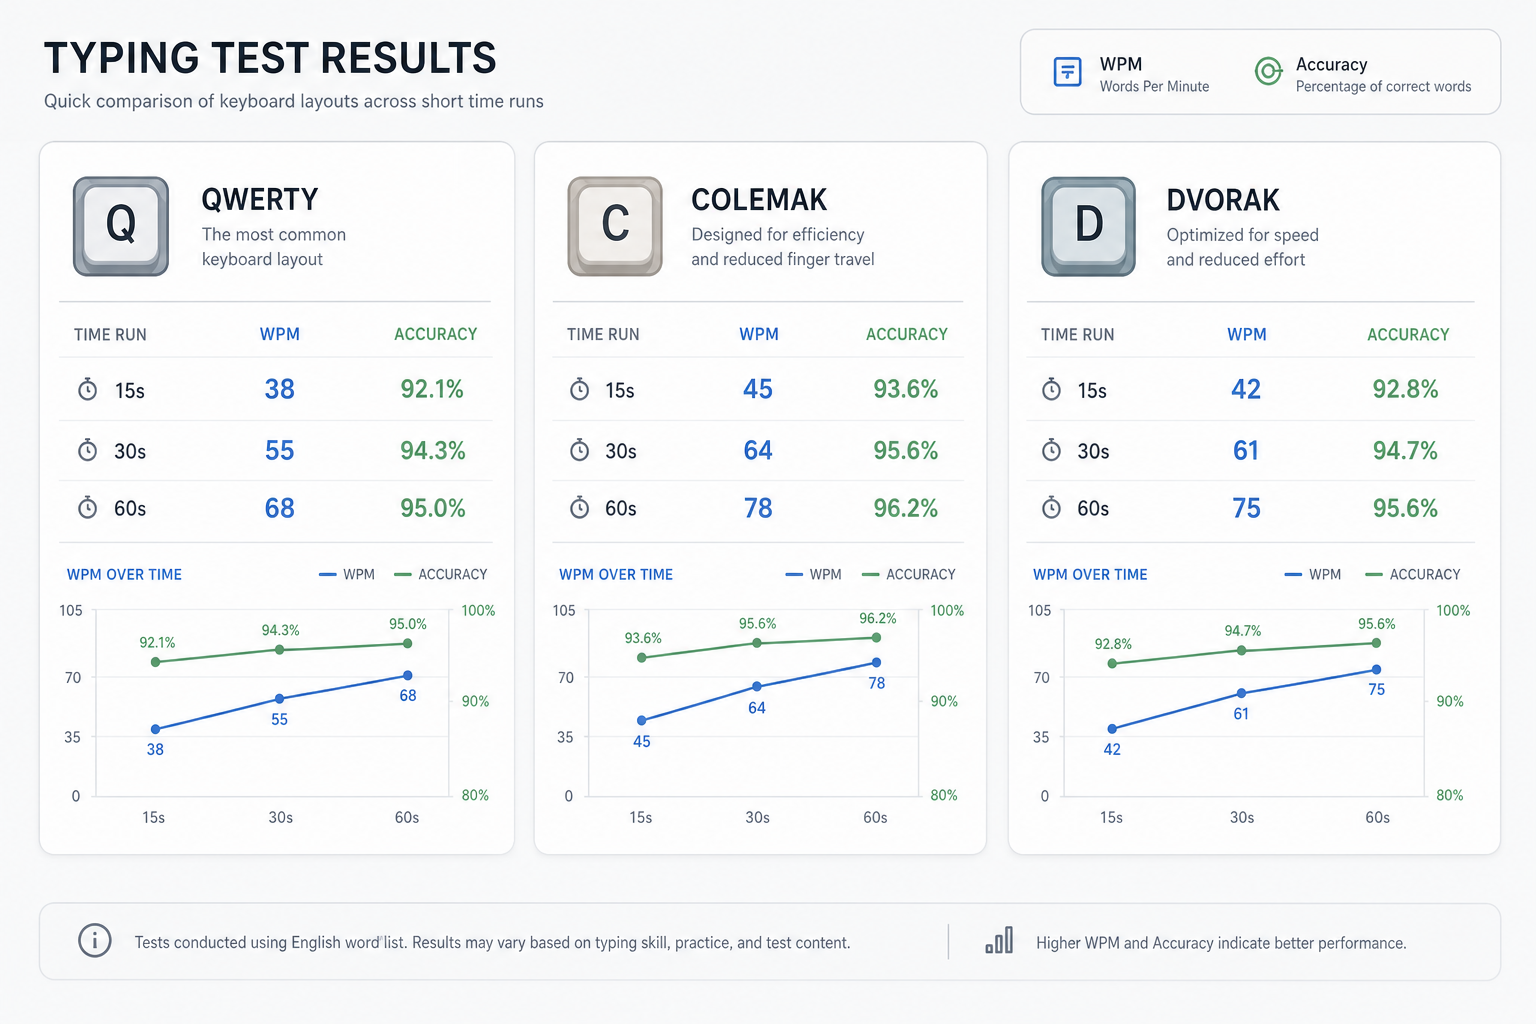
A WPM typing test can compare keyboard layouts fairly when you hold test duration, text difficulty, correction policy, and warmup constant. Use the same protocol for QWERTY, Colemak, and Dvorak, then compare median WPM, accuracy, and error cost across repeated runs. That method turns layout decisions into measured trade-offs instead of guesswork.
If you are calibrating your setup first, read Type Speed Test Keyboard Setup: Build Stable WPM You Can Reproduce. If you need duration normalization, pair this guide with Typing Test WPM: Normalize Scores Across Duration and Difficulty. If your target is 80 WPM, keep this open next to WPM Typing Test: A Practical Plan to Reach 80 WPM Without Accuracy Drop.
# Why layout comparisons often produce misleading WPM typing test scores
Most layout comparisons mix too many variables in one week. People change layout and also change keyboard, switch browser, test at random times, and swap 15 second tests with 60 second tests. The result is noisy data.
A useful comparison isolates one change: key mapping. Everything else stays fixed.
When the setup is stable, you can answer practical questions:
- Does a layout increase short burst speed only, or also sustained speed?
- Does accuracy hold under minute long runs?
- Does correction cost rise when punctuation appears?
- How many days until performance stabilizes enough to trust trend lines?
Those answers matter more than one personal best screenshot.
# WPM typing test protocol for QWERTY, Colemak, and Dvorak
Use this protocol for two to four weeks per layout. Keep it boring. Boring data is useful data.
# Controlled variables
Lock these variables before day one:
- Same keyboard hardware and connection mode.
- Same operating system keyboard settings.
- Same browser and extension set.
- Same test durations: 15, 30, and 60 seconds.
- Same time window each day when possible.
- Same warmup sequence.
Operating system and browser keyboard event handling can affect typing behavior, especially around modifiers and punctuation. If you want implementation detail, review W3C UI Events KeyboardEvent code values (opens new window) and MDN KeyboardEvent reference (opens new window).
# Session structure
Run one daily session per layout block:
- Warmup for 3 minutes on the active layout.
- Run three tests at 15 seconds.
- Run three tests at 30 seconds.
- Run three tests at 60 seconds.
- Rest 60 to 90 seconds between runs.
- Record raw WPM, accuracy, and corrected errors.
Nine runs per day gives enough signal without turning the protocol into a part time job.
# Scoring fields to capture
Track these columns in a sheet:
- Date
- Layout
- Duration
- WPM
- Accuracy
- Uncorrected errors
- Corrected errors
- Notes (fatigue, interruptions, unusual conditions)
Corrected errors are useful because a layout can look fast while consuming more backspaces. In real work, that overhead matters.
# Decision checklist: when a layout is genuinely better
Use this checklist before declaring a winner.
- Median 60 second WPM is at least 5 percent higher for seven consecutive days.
- Median accuracy stays within 1 percentage point of baseline or improves.
- Corrected error rate does not increase over the same period.
- Performance remains stable across punctuation heavy passages.
- Gains hold after one rest day.
If two or more items fail, keep training and postpone conclusions.
# What a fair layout transition looks like in practice
Layout transitions follow a predictable curve. The first stage usually shows a sharp drop in WPM and accuracy. The second stage restores accuracy first. The third stage restores speed. Plateau timing differs by training volume and prior habits.
# Stage 1: adaptation shock
During the first several days, speed drops. That is expected. You are remapping motor patterns.
Treat this stage as coordination training, not benchmarking. Track data anyway; it helps you estimate recovery slope later.
# Stage 2: accuracy recovery
Accuracy usually rebounds before speed. This is where many people quit too early because they focus on peak WPM only.
Keep duration mix balanced. Very short tests can hide transition costs because they underweight fatigue and correction load.
# Stage 3: sustained speed recovery
Once accuracy stabilizes, 60 second performance starts to climb. This stage determines whether the layout change improves real throughput.
A layout that only improves 15 second bursts may still feel good, but it may not improve daily writing output.
# Duration effects: why 15 second gains can mislead layout decisions
Short tests measure launch speed and rhythm lock. Longer tests measure endurance, error control, and correction efficiency.
You need both, but for practical writing performance, prioritize 60 second trends.
Use this interpretation model:
- 15 second WPM up, 60 second flat: rhythm gain without endurance gain.
- 15 and 30 second up, 60 second down: correction cost likely too high.
- 60 second up with flat accuracy: probable real throughput gain.
- 60 second up with accuracy down sharply: speed gain may be unusable in work tasks.
If your 60 second score behaves unpredictably, revisit setup controls in Type Speed Test Baseline Routine: Measure Real Progress Before You Train.
# Practical training plan during a layout switch
Use a split plan that balances adaptation and measurement.
# Four day microcycle
Day 1 and Day 2:
- 70 percent low pressure drills.
- 30 percent measured tests.
Day 3:
- 50 percent drills.
- 50 percent measured tests.
Day 4:
- Measurement day with full 15, 30, 60 second protocol.
Then repeat. This keeps progress visible while preserving enough low pressure practice to build muscle memory.
# Drill mix by objective
For key remapping:
- Home row transitions.
- Common bigrams and trigrams.
- Punctuation clusters you use in real writing.
For speed stabilization:
- 30 second tempo blocks.
- 60 second steady state runs.
- Controlled correction drills where you fix errors immediately and continue rhythm.
You can combine this with Typing Speed Test Error Recovery: The Metric That Predicts Real Writing Throughput to keep correction overhead visible.
# How to interpret QWERTY, Colemak, and Dvorak outcomes
The right layout is the one that improves your sustained, accurate output under your real task mix.
Layout decisions are context dependent:
- If you work across many shared machines, switching costs matter.
- If your workload is code heavy, symbol and modifier transitions matter more.
- If your workload is prose heavy, sustained rhythm and fatigue trend matter most.
Platform support also matters for daily friction. Check your operating system layout management options before committing to a migration path, for example Windows keyboard layout management (opens new window), Apple keyboard input source settings (opens new window), and Linux input source configuration in GNOME (opens new window).
If availability and setup friction are high in your environment, the expected speed gain needs to be higher to justify the switch.
# Common errors that invalidate a WPM typing test layout comparison
These issues appear in many personal experiments:
# Changing text difficulty across layouts
Comparing easy word lists on one layout and punctuation dense text on another breaks the result. Keep difficulty class fixed.
# Mixing correction policies
Some sessions allow aggressive backspacing and others encourage flow. Choose one policy and document it.
# Testing only at one duration
A single duration can hide practical differences. Always keep at least 30 and 60 second runs in the set.
# Ignoring adaptation window
Early scores during a switch are useful for trend shape, not final ranking. Wait for stabilization before making conclusions.
# Confusing novelty with improvement
A new layout can feel engaging. Engagement helps consistency, which is useful. Still, ranking layouts requires metric evidence over time.
# Example weekly review template
Run this review every seven days:
- Compute median WPM for each duration and layout.
- Compute median accuracy for each duration and layout.
- Compute corrected errors per minute.
- Compare against prior week medians.
- Mark trends as improving, flat, or unstable.
- Decide one training adjustment for next week.
Keep one change per week. That keeps causality readable.
# External references for deeper methodology
If you want to validate implementation details and layout context, these sources are useful:
- W3C UI Events KeyboardEvent code values (opens new window)
- MDN KeyboardEvent reference (opens new window)
- Windows input and display language settings (opens new window)
- Apple input source settings on macOS (opens new window)
- GNOME keyboard layout settings (opens new window)
Use platform documentation to reduce migration friction, then use your own measured results to choose the layout.
# Conclusion
A fair WPM typing test for layout switching uses fixed conditions, repeated runs, and duration aware interpretation. Measure QWERTY, Colemak, and Dvorak with the same protocol. Compare median 60 second WPM, accuracy stability, and correction cost over at least one full adaptation window. Then choose the layout that improves sustained output in your real tasks. If you want to operationalize this quickly, run the checklist in this guide for two weeks and review weekly medians before making a permanent switch.